UPDATED – 2-4-25
At today’s WIAA Advisory Council meeting, the group voted 17-0 to advance part 1 of the FB Playoff Matrix (using matrix for qualifying and seeding) and 15-1 to advance part 2 of the matrix (using for regional groupings). Both advance to tomorrow’s Board of Control meeting.
(2-1-25) Wisconsin’s proposed new high school football playoff ranking program is based in part on the Ohio High School Athletic Association Harbin Points system created in 1971…a system developed by Jack Harbin of Cleveland and used with his permission.
What is the Harbin point system?
The idea behind Harbin’s system was simple. Teams earned points for each win. They earned additional points for each victory recorded by a defeated opponent. Point values for each school were based on enrollment, with the highest point values given to the largest schools.
How good is the Ohio system…this past year of the 14 state final teams (in 7 divisions) ….11 of them were #1 seeds and the other 3 were #2 seeds….very impressive.
The Wisconsin Interscholastic Athletic Association (WIAA) is hoping to avoid a snafu from the current rating system that left two schools in 2024, who should have qualified, out of the playoffs.
The below proposal, parts or all of it, will be considered by the association very soon to replace the current system.
- Wisconsin Football Playoff Matrix, Ohio’s Joe Eitel Inspired One Site
- Two Wisconsin Schools Missed Playoffs Due To WIAA Qualifying Error
Wisconsin Football Playoff Matrix Proposal
Executive Summary
The Wisconsin Football Playoff Matrix introduces a fair, data-driven approach to high school football playoffs, designed to ensure transparency, reduce travel, and provide consistency. Developed by Andy LaVoy and Jesse Norris of Edgewood High School in collaboration with the WFCA Executive Board, the system draws inspiration from the Ohio High School Athletic Association (OHSAA), while addressing Wisconsin’s unique needs. We conducted a poll of over 400 head coaches across the state, with 87.5% endorsing the proposed system.
We aim to ensure transparency in the seeding and qualification process while maintaining a system of checks and balances with the WIAA. Our approach prioritizes minimizing travel distances where possible, while also ensuring that schools from all regions of the state have a fair opportunity to compete for a spot at Camp Randall in the state championship.
Key Features
- Division Placement: Seven divisions based on enrollment, evenly distributed for fair competition, and established before each season starts.
- Ranking System:
- Teams earn Tier 1 points for wins, scaled by the division strength of their opponents.
- Tier 2 points reward quality wins by factoring in the success of defeated opponents.
- Combined scores provide a clear, objective ranking for playoff qualification.
- Playoff Qualification: Top 32 teams in each division qualify for postseason play.
- Seeding and Regions: Teams are seeded 1–8, assigned to one of four geographic regions (A, B, C, D) to minimize travel, and ensure regional representation giving all areas of the state an equal opportunity to play for a state championship.
Benefits
- Fairness: Objective rankings and clear rules ensure equal opportunities.
- Travel Reduction: Geographic seeding minimizes travel for teams and fans.
- Consistency and Transparency: A fully computerized system eliminates subjective decisions and ensures results are clear and reliable.
- Checks and Balances: The WFCA can run an unofficial program alongside the WIAA’s official process, allowing results to be compared weekly for accuracy and alignment.
- Improved Scheduling Control/Realignment: The matrix addresses complaints about realignment by scoring two non-conference games equally, giving teams greater control over their overall schedule.
- Proven Track Record: Ohio has successfully used this qualification and seeding method for over 30 years.
- Geographic Representation: The 2024 implementation showed better geographic representation in 5 of the 7 divisions. See explanation and example
- Division Placement and Performance Factor: Both are determined before the season begins, ensuring clarity and consistency in planning.
- Efficient Playoff Selection Process: On the final Friday of the regular season, the matrix will finalize playoff seeding and qualification immediately after the last game score is entered, streamlining what has traditionally been a lengthy process.
Implementation and Next Steps
This proposal is designed for immediate implementation in the 2025 season, with minimal adjustments needed for schools and administrators. The system can be used for both 11 player and 8 player leagues. Stakeholder feedback from the WIAA, coaches, and school administrators is encouraged to refine the system further and ensure a smooth transition.
Explainer Video: https://www.loom.com/share/7c231f2d83df4ecd95a6fff78d850e25
2024 Hypothetical Results Website: https://andylavoy.com/football
Division Placement
DIVISIONS are calculated before the season starts, based upon the enrollment numbers from the previous school year. The largest schools will be placed in D1, the smallest in D7. We will break the DIVISIONS down 1 through 7 as evenly possible, with the remainders placed evenly in larger-enrollment DIVISIONS on down.
8-Player will be considered its own DIVISION for the purposes of the rest of this document.
The WIAA Performance Factor will continue to be applied without modification.
Ranking Methodology
Tier 1 POINTS are awarded for each win:
- Win over a DIVISION 1 school – 6.5 POINTS
- Win over a DIVISION 2 school – 6.0 POINTS
- Win over a DIVISION 3 school – 5.5 POINTS
- Win over a DIVISION 4 school – 5.0 POINTS
- Win over a DIVISION 5 school – 4.5 POINTS
- Win over a DIVISION 6 school – 4.0 POINTS
- Win over a DIVISION 7 school – 3.5 POINTS
- Win over an 8-Player school – 3.0 POINTS
- Win over an 8-Player school with over 200 enrollment – 3.3 POINTS
The steps to calculate a team’s TOTAL are as follows:
- Calculate Tier 1 POINTS for each win.
- Divide by the number of games played to get the Tier 1 SCORE.
- To get TIer 2 POINTS you add the total of defeated opponents’ Tier 1 POINTS.
- Divide Tier 2 POINTS by opponents’ games played and multiply by 9.
- We multiply by 9 to give a 100% bonus to your Strength of Victory.
- Add Tier 1 SCORE and Tier 2 SCORE to get the TOTAL.
Franklin’s 2024 TOTAL calculation
(56.0 / 9) + (228.5 / 81 * 9) = 31.61
Teams will be RANKED within their own DIVISION based upon their TOTAL.
Playoff Qualification
The top 32 teams from each DIVISION will be the qualifying field, as set Friday Night of Week 9 at 11:59pm.
Seeding and Regional Alignment
After RANKING is complete, teams will be assigned a SEED based on their RANK within their respective DIVISION. The top 4 teams in each DIVISION will receive a #1 SEED, the next 4 teams a #2 SEED, and so on through #8 SEED.
Regional Alignment for Seeds #1–#4
For the #1 SEEDS, teams will be assigned into one of four regions—A, B, C, and D
Travel Optimization for Seeds #2–#8
For SEEDS #2–#4, teams will be assigned to the region where the teams’ cumulative total drive time to each of the #1 SEEDS is minimized. #4 and #3 will be placed directly with their likely 2nd Level opponent, the #1 and #2 SEEDS respectively. The #2 will be placed with their closest #1 SEED, their likely 3rd Level opponent.
For lower SEEDS (#5–#8), matchups prioritize minimal travel distance directly between first Level opponents. For each first Level away team seed (e.g., #5 SEEDS) and their respective home teams (e.g., #4 SEEDS), all 24 travel distance permutations are calculated, and the matchups with the lowest total travel are chosen, with each away team assigned to the region of its paired home team.
We will prioritize minimizing total travel distance within each region while also considering the longest individual trip. During the calculations, we will track the longest trip assigned to any team within a region. If an alternative arrangement shortens the longest trip and the reduction in the longest trip exceeds the additional total distance incurred (without increasing total travel by more than 10%), we will select the option with the shorter longest trip. This ensures that travel burdens are more evenly distributed, preventing any single team from being disproportionately affected by the regional alignment.
Hosting Privileges
The higher SEED in each of the first three Levels will host the game.
This system balances the competition of each bracket while prioritizing logistical efficiency for lower-ranked teams, rewarding regular-season success while minimizing travel burdens.
Handling Special Cases
Forfeits
Forfeits are counted as valid games unless replaced by a different game the same week.
If a team replaces a forfeit win with a new game, the forfeit win will count if the team loses the replacement game. If the team wins the replacement game, the replacement game will be used. This encourages teams to schedule replacement games without risking their playoff score.
No Contests
No-Contest games are not counted.
Out-of-State Games
Enrollment for each out-of-state opponent is collected and the opponent is given an equivalent Wisconsin DIVISION for the purposes of Tier 1 POINTS. If the enrollment falls between the Wisconsin cut lines, the lower-enrollment DIVISION will be used.
All regular season games that end before 11:59 pm Friday of Week 9 are counted in the formula.
Tier 2 POINTS for out-of-state opponents are totaled using all of their games played with the POINTS they accumulated within the division that school was placed within the Wisconsin enrollment.
Tied Games
Ties result in half of the point value being earned.
Ties in the TOTAL
In the event of a tie in the RANKINGS, and only in the event of a tie, we will compare the Tier 3 SCORE: This is the average of your defeated opponents’ Tier 2 SCORE.
Ties in Enrollment
If two or more schools have the same enrollment, the previous year’s enrollment will be used as the tiebreaker for the sake of determining DIVISIONS.
Example Application: 2024 Franklin
Division Placement
In 2024 we had 364 teams, which evenly divides each DIVISION into 52 teams.
Franklin has an enrollment of 1606 and is subject to the Performance Factor, which is larger than the 52nd largest school in the state, placing them in DIVISION 1 before the start of the season.
Ranking Methodology
Franklin was 9-0, with 5x D1 wins (worth 6.5 POINTS each), 3x D2 wins (worth 6.0 POINTS each), and 1x D3 wins (worth 5.5 each).
(5 x 6.5) + (3 x 6.0) + (1 x 5.5) = 56.0 Tier 1 POINTS
They played 9 games, so their Tier 1 DIVISOR is 9.
Totalling up all of their defeated opponents (which is all 9 in Franklin’s case), their Tier 2 POINTS comes to 228.5.
Their opponents played a combined total of 81 games, so their Tier 2 DIVISOR is 81.
To determine their TOTAL score we do the following:
L1 POINTS / L1 DIVISOR + 9 x L2 POINTS / L2 DIVISOR
(56.0 / 9) + (9 * 228.5 / 81) = 31.61
Seeding and Regional Alignment
Franklin is top 32 in the state for DIVISION 1, they qualify for the playoffs.
Franklin has a higher TOTAL than every other team in DIVISION 1, they are RANKED #1.
Because Franklin is RANKED #1, they have earned a #1 SEED.
The other Top-4 RANKED teams within DIVISION 1 are: Verona, Oconomoc, and Kimberly. They will all receive a #1 SEED and will host up to 3 home games during the playoffs, and be the top SEED in their REGION.
Calculating their total distances to the four corners of the State, we find the shortest overall travel for the four teams places each team in the following REGIONS:
- A: Kimberly, B: Oconomowoc, C: Verona, D: Franklin
OHSAA Football Playoff Rankings
Check out – joeeitel.com for rankings in the OHSAA
Toledo Blade story from 2024 –
The ratings formula he devised is based on the Ohio High School Athletic Association’s playoff rating algorithm which was originally developed by Jack Harbin. Eitel rewrote the program from scratch and the same basic program has been utilized since 2001 with several enhancements and upgrades.
COLUMBUS, Ohio – As a direct request from the Ohio High School Football Coaches Association Tournament Committee, and approved by the OHSAA Board of Directors, a new divisor is used to determine second level points that is based on the number of games that opponents have played to date. For each open date that an opponent has had to date, a smaller divisor is used to calculate second level points.
Before any games are played, the computer assumes that the opponents on each school’s schedule will play a full complement of games and assigns the divisor of 100 (10 weeks times 10 opponents = 100). After each week of the season, for each open date that occurs for an opponent that a school has played to date, the computer subtracts the divisor by one. In other words, if week five has just been completed and all five of a school’s opponents have played a full complement of games, then the divisor remains at 100, and second level points are divided by 100. If one opponent on a school’s schedule to date has had an open date, then the divisor reduces by one to 99, and second level points are divided by 99. If two opponents on a school’s schedule to date have had an open date, then the divisor reduces by two to 98, and second level points are divided by 98, and so on. The second level points are then multiplied by the factor 10 in order to move the decimal point higher so that the averages are comparable to those in past years. First and second level point averages are then added together for an average total.
Ties result in half of the point value being earned.
The following is an example of how the points are awarded and how to read the OHSAA Computer Rankings:
KEY
Wins over a Division I school – 6.5 points
Wins over a Division II school – 6.0 points
Wins over a Division III school – 5.5 points
Wins over a Division IV school – 5.0 points
Wins over a Division V school – 4.5 points
Wins over a Division VI school – 4.0 points
Wins over a Division VII school – 3.5 points
For more information, please view the OHSAA football tournament regulations.
COMPUTER RANKINGS EXAMPLE
- Team A, a Division III school, is 3-0.
- Each opponent Team A has defeated is Division III.
- Opponents 1 and 2, which Team A has defeated, are each 2-1, with their victories coming over Division III schools.
- Opponent 3, which Team A has defeated, is 1-1, with its victory coming over a Division III school. Opponent 3 has had one open date.
First level points – 16.5 points {3 wins times 5.5 points (for defeating Division III opponents)} divided by 3 (the number of games Team A has played thus far) = 5.5000 first level points.
Second level points – 11.0 from Opponent 1 {2 wins times 5.5 (for defeating Division III opponents)}, 11.0 from Opponent 2 {2 wins times 5.5 (for defeating Division III opponents)} and 5.5 from Opponent 3 {1 win times 5.5 (for defeating a Division III opponent)} for 27.5 points. These 27.5 points are then divided by 99 (since Opponent 3 thus far has had an open date) and multiplied by 10 = 2.7778 second level points.
Total Points: 5.5000 (first level points) plus 2.7778 (second level points) = 8.2778
NOTE: Say during week four, Opponent 1 has an open date. Then the second level points divisor for Team A after week four becomes 98, since Opponent 3 has had one open date and now Opponent 1 has had one open date.
HOW TO READ YOUR OHSAA COMPUTER RANKINGS
| LEVEL-1 | LEVEL-2 | AVERAGE | RANK | CITY | HIGH SCHOOL NAME |
| 16.5000 | 27.5000 | 8.2778 | 1 | A-TOWN | TEAM A |
- To find out what the first level average is, divide the 16.5 points by the number of games Team A has played to date (16.5 divided by 3 = 5.5000)
- Next, subtract the 5.5000 from the total average of 8.2778. This number (2.7778) shows what the second level average is.
- So, 5.5000 first level points plus 2.7778 second level points = 8.2778 total points.
- To find out what divisor was used to determine second level points, divide the total level-2 points (27.5000) by the second level average (2.7778). So, 27.5000 divided by 2.7778 = 9.8999208. This means the divisor used was 99, which shows that one of Team A’s opponents has had an open date.
NOTE
Please keep in mind that forfeitures of games, cancellations of games and the filling of open dates all greatly impact the rankings from week to week. In addition, results reported to the OHSAA are occasionally accidentally reversed. These are corrected once accurate information is relayed to the OHSAA.
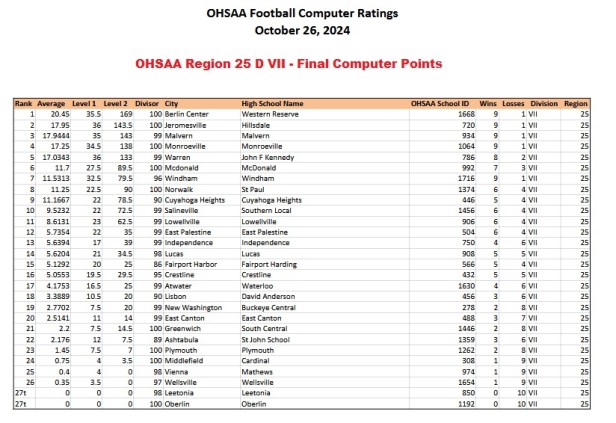
Actual examples….
Final 2024 Region 25 D VII Rankings (courtesy www.joeeitel.com)
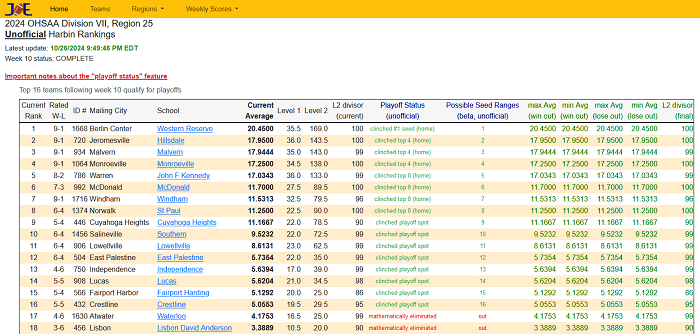
from the OHSAA